
Executive Summary
The consensus worry is that climate change will make insurance more expensive. The more useful worry is that it will make insurance unavailable, and the two are not the same problem.
A premium that rises 15% can be modelled. It flows into a discounted cash flow, compresses a margin, widens a cap rate, and the asset reprices in an orderly way. Markets are competent at repricing continuous variables. What they handle badly is discontinuity: the renewal that does not arrive, the carrier that exists as a postcode, the lender's insurance covenant that can no longer be satisfied at any price the borrower will pay. That is the mechanism we think is misplaced, and it is the organising idea of this note.
Our central claim is straightforward and, we accept, somewhat against the present mood. Insurance is migrating from a consequence of economic activity to a precondition for it. Where risk cannot be priced into a contract that a lender, a regulator or a counterparty requires, capital does not arrive at a higher cost. It does not arrive at all. The contrast does not operate on the price of capital. It operates on the gate.
Two facts sit awkwardly together and most commentary picks one and ignores the other. First, insured catastrophe losses have exceeded USD 100 billion for six consecutive years, growing on a 5 to 7% real trend, with a global protection that ran to USD 181 billion in 2024 alone (Swiss Re Institute, 2025; 2026). Second, the reinsurance market that is meant to absorb this is awash with capital and has been cutting prices: global property-catastrophe rates fell roughly 12 to 15% at the January 2026 renewals, the steepest decline since 2014, with reinsurer returns on equity comfortably above the cost of capital for a third straight year (Guy Carpenter, 2026; Howden Re, 2026). The aggregate market is not short of money. It is the local pricing function that is breaking, peril by peril and postcode by postcode.
This bifurcation matters because it disarms the usual warning signals. The 2023 hard market looked like it would be the great repricing. The 2025-2026 softening looks like the all-clear. Capital abundance at the top of the tower is masking a slow contraction of the insurability frontier at its base. When that closure/retreat moves through a region the repricing is not gradual. It is a step change in who can own, finance and build there.
We trace the transmission through four channels and illustrate each with a simplified framework: real estate and mortgages, sovereign and municipal credit, infrastructure and the energy transition, and the private-capital markets now absorbing the risk that public insurers will not. The climate constraint does not bite through the premium. It bites through the renewal.
The central climate-finance risk for capital markets is not rising insurance premiums; it is the loss of insurability at the limits required for financing.
1. Structural Shift: From Risk Transfer to Capital Gatekeeping
For most of the post-war period, insurance was plumbing. It sat downstream of the real decision. You built the factory, bought the house, financed the port, and then you insured it, because insurance was cheap, abundant and broadly fungible. The product existed to socialise idiosyncratic, largely uncorrelated risk. Its defining feature was that it was almost never determined on whether the underlying activity happened.
The ordering is reversing in specific places and for specific perils. The lender now wants evidence of insurability before it will write the mortgage. The infrastructure financier wants binding insurance programme before financial close. The reinsurer's appetite, expressed through attachment points and exclusions, sets the boundary of what the primary carrier can offer, which in turn sets the boundary of what a bank will lend against. Insurance has moved upstream of the capital decision. It has become a gatekeeper.
The mechanism is not that insurers are running out of money. It is that catastrophe risk has acquired two properties that conventional underwriting dislikes. It is increasingly correlated, both spatially and across perils, which defeats the diversification on which the whole edifice rests. And it is non-stationary: the historical loss record, the foundation of any actuarial price, is a degrading guide to the forward distribution. Swiss Re's own analysis notes that for some perils and regions, hazard and vulnerability are now evolving faster than asset growth alone would predict (Swiss Re Institute, 2026). When an underwriter cannot trust the tail, the rational response is not to charge more. Past a point, it is to stop writing the cover.
This is why the protection gap is the wrong headline metric on its own. A gap implies a quantity of unbought insurance, a coverage shortfall that money could close. The sharper problem is the supply curve going vertical and then disappearing in certain segments, so that the marginal buyer cannot transact at any price. The protection gap measures underinsurance. The constraint we are describing is uninsurability, and the difference between a deductible and a locked door.
The capital-markets implication follows directly. If insurability gates ownership and financing, then the insurability map becomes a map of where capital can be deployed at scale. That map is not the same as the climate-hazard map, and the gap between them is where the analytical work sits. Hazard is necessary but not sufficient. What determines capital access is the interaction of hazard, the regulatory ability of carriers to charge a clearing price, the willingness of reinsurers to stand behind the primary layer, and the presence of a fiscal backstop. California has a high wildfire hazard and a regulatory regime that long suppressed clearing prices, which is why the retreat there has been disorderly. The lesson is that the binding variable is often the price-setting mechanism, not the weather.
2. The Economics of Insurance Pricing Under Climate Volatility
To see why volatility, rather than the level of expected loss, is the active ingredient, start with how a property-catastrophe price is built. A reinsurer's rate is roughly the modelled expected loss, plus a loading for the cost of the capital it must hold against the tail, plus expenses and profit. The expected loss has risen, but the more violent move is in the capital loading, because climate change widens and fattens the tail, and the cost of holding capital against a fatter tail is convex. Double the volatility and you do not double the price. You can quadruple the capital charge on the upper layers, which is precisely where withdrawal happens first.
This is the analytical core that ESG framing tends to miss. The conversation about "pricing in climate" imagines a smooth upward adjustment in premiums. The real dynamic is a change in the shape of the loss distribution that makes the high-severity, low-frequency layers economically unattractive to underwrite at all. Reinsurers have responded not mainly by raising rate but by lifting attachment points, the level at which their cover kicks in. The effect of the 2023 hard market was less a price rise than a structural transfer of frequency risk back down to primary insurers and, through them, to policyholders. Reinsurers now sit high up the tower, which is why their share of catastrophe losses fell from around 20% before 2023 to roughly 11% in 2025 (Guy Carpenter, 2026). They repriced by retreating from the messy middle, not by charging more for it.
Here is the friction the bullish reading underplays, and it cuts both ways. The reinsurance market in 2025 and into 2026 has been soft. Abundant capital, two benign-to-moderate loss years and strong retained earnings drove global property-catastrophe rates down by an average of 14.7% at the January 2026 renewals, with property retrocession down 16.5%, the sharpest fall in over a decade (Howden Re, 2026). Traditional reinsurance capital sits near USD 500 billion, with alternative capital including a catastrophe-bond market north of USD 50 billion adding further capacity (Swiss Re Institute, 2025; Guy Carpenter, 2026). On any aggregate measure, the system is more than able to absorb a peak-loss year, including a modelled one-in-ten outcome of USD 300 billion or more.
So, is the constraint real or is it just a story? It's both, and the timing is the trap. The soft market is a cyclical phenomenon driven by capital flows and a run of years in which losses came in below the long run trend. The narrowing of insurability is a structural phenomenon driven by hazard. The first is currently masking the second. A flush reinsurance sector lowers the cost of cover for primary carriers and buys time, which delays the point at which they must either secure ruinous rate increases from regulators or instead withdraw. The danger is reading the cyclical signal as a structural one. The 2025 Los Angeles wildfires produced the largest insured wildfire loss on record, with combined insured losses at around USD 40 billion, and the market still softened (Swiss Re Institute, 2026; Howden Re, 2026). That is not evidence that the risk is contained. It is evidence that capital is currently willing to look through it, which is a sentiment, and sentiment turns.
The practical consequence for asset owners is that today's affordable insurance line is not a reliable forward indicator. The contract is annual.
The asset is not.
3. Real Estate and the Mortgage Transmission Mechanism
Real estate is where the constraint moves from abstraction to balance sheet, because property is the asset class most tightly coupled to mandatory insurance and long-duration debt. Two transmission paths run in parallel: through valuation, via the discount rate, and through affordability, via the mortgage.
Framework 1: Asset valuation sensitivity to an insurance cost shock
Insurance is an operating cost, so a permanent premium increase compresses net operating income mechanically. That is the part everyone models. The larger effect runs through the capitalisation rate, because the market prices not only higher costs, but the uncertainty about whether cover will be available, and at what price, at the next renewal. The discount rate channel capitalises a risk; the cash-flow channel only capitalises a cost.
Take a stylised commercial asset. Assumptions are illustrative, chosen to essentially isolate the mechanism.
Framework 1 | Asset valuation sensitivity to an insurance cost shock
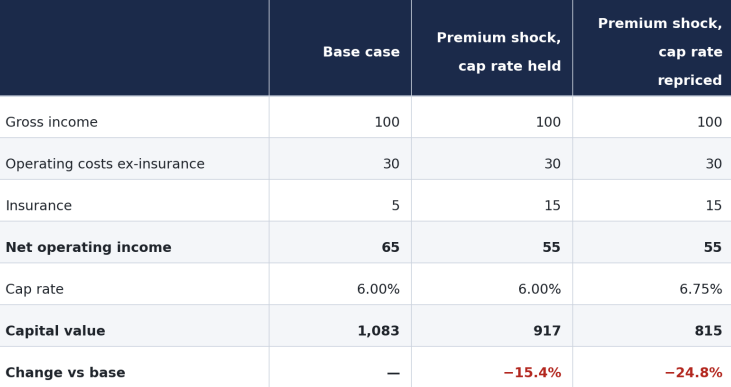
The tripling of insurance cost, consistent with what high-hazard coastal and wildfire-exposed assets have seen, removes about 15% of value through cash flow alone. The market then adds a 75-basis point widening in the cap rate to reflect availability risk, and total value ends up falling closer to 25%. The discount rate channel does more damage than the income channel, and it does so by pricing the possibility of future uninsurability rather than any realised cost.
Now to talk about the discontinuity. If the asset becomes uninsurable at the limits that the mortgage requires, then the lender's covenant breaks. Financing is not repriced; it is withdrawn. The buyer pool collapses from the leveraged majority to the all-cash minority, the cap rate stops being a meaningful concept because there is no functioning yield-based market, and the asset trades, if at all, at a liquidity-impaired clearing price that bears little relation to its cash flow. This is the step change. It does not appear in a sensitivity table because it is not a sensitivity. It is a phase transition.
Framework 2: Mortgage affordability under rising premiums
The same shock is transmitted through household debt, and here the constraint caps clearing prices directly. A mortgage is qualified on a debt-to-income ratio that includes principal, interest, taxes and insurance. When insurance rises, the borrower's capacity to support principal falls, leading to the price they can pay falling with it.
Stylised, with a 30-year loan at 6.5% and an 80% loan-to-value ratio on a USD 400,000 home:
Framework 2 | Mortgage affordability under rising premiums
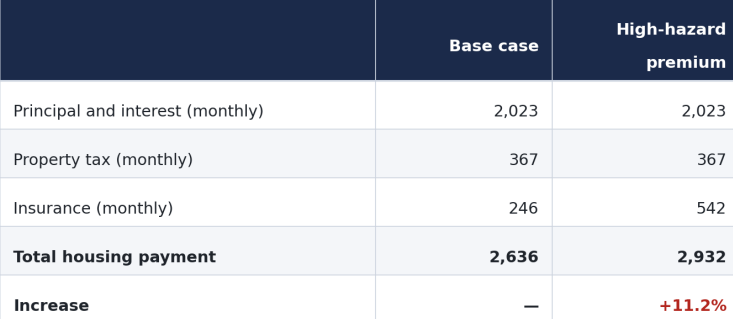
To hold the monthly payment constant, that extra USD 296 has to come out of the financiable principal. At prevailing rates, it corresponds to roughly USD 47,000 less mortgage, which implies a clearing price around 11 to 12% lower for an income-constrained buyer in the high-hazard zone, holding rates and incomes fixed. Insurance is no longer a line item. It is a cap on the price the marginal buyer can bid.
The systemic layer sits behind this. Around 70% of US mortgages are sold to Fannie Mae and Freddie Mac and are subject to their insurance requirements (Yahoo Finance/Fannie Mae, 2026). As premiums surged, average homeowner premiums rose roughly 12% in 2025 to near USD 2,950, and the share of uninsured homeowners more than doubled from around 5% to 12% between 2015 and 2023 (Insurify, 2026; Levy Institute, 2026). Due to this the agencies have begun to relax their own standards, accepting cheaper actual cash value policies in place of full replacement cover, an accommodation that quietly transfers tail risk from the insurance system onto borrowers and, ultimately, onto the guarantor and the taxpayer (Urban Institute, 2025; Fannie Mae, 2026). The duration mismatch is explicit and rarely stated so plainly: the standard insurance contract runs one year, the mortgage runs thirty, and a requirement on the borrower means nothing once the carrier declines to renew. Federal Reserve Chair Powell has warned, in substance, that on a ten-to-fifteen-year horizon there will be regions where mortgages, branches and basic financial infrastructure simply withdraw (Powell, 2025).
The Californian experience is the live case study. State Farm stopped writing new home policies in 2023 and moved to non-renew around 72,000 policies in 2024, roughly 30,000 of these being homeowners and 42,000 commercial apartment cover, citing reinsurance costs and a regulatory regime that would not let it charge a clearing price (California DOI; State Farm, 2024 to 2026). The state's insurer of last resort, the FAIR Plan, roughly doubled in three years to over 450,000 dwelling policies, with residential exposure of around USD 458 billion by September of 2024 (California Fair Plan; Insurance Business, 2026). When the January 2025 Los Angeles wildfires hit, the FAIR Plan levied a USD 1 billion assessment, part recouped from carriers and therefore ultimately from policyholders statewide (State Farm, 2025). A backstop that grows to that size is not a backstop. It is the market.
4. Sovereign Debt, Municipal Finance and Fiscal Stress
When private insurance retreats, the liability does not just disappear. It migrates onto the public balance sheet, and from there into the price of public debt.
Framework 3: Climate exposure to sovereign and municipal spreads
The transmission runs in a chain that is easy to state and uncomfortable to escape. Physical losses create fiscal contingent liabilities through reconstruction, disaster relief and the funding of insurers of last resort. Those liabilities widen the deficit and lift the debt path. A weaker debt path attracts rating pressure and a higher risk premium. Higher debt service then crowds out the very adaptation spending that would inherently reduce future losses. Researchers have named the loop honestly: a climate-debt doom loop, in which the cost of carrying climate risk degrades the capacity to manage it (CEPR, 2021).
The empirical work is now firm enough to use. Klusak and co-authors, in Management Science, estimate that under a high-emissions pathway 59 sovereigns face climate-induced downgrades by 2030, averaging 0.68 of a notch, rising to 81 sovereigns and 2.18 notches by 2100; the additional annual sovereign interest burden runs from USD 45 to 67 billion under a Paris-consistent path to USD 135 to 204 billion under high emissions (Klusak et al., 2023). Cevik and Jalles, across a panel of nearly 100 countries, find that climate vulnerability raises sovereign yields and spreads even after controlling for the usual fiscal variables, and that resilience lowers them (Cevik and Jalles, 2020; 2022). The point worth holding is that the climate-vulnerable tercile of EU sovereigns already carries materially higher debt, around 133% of GDP against 78% for the least vulnerable, so the channel compounds an existing weakness rather than introducing a fresh one (CEPR, 2011).
Municipal finance is where this is most immediate, because the local property tax base is the collateral and insurance retreat erodes it directly. Consider a stylised county with USD 50 billion of assessed value, 15% of it in high-hazard coastal or woodland-urban-interface zones; the assessed base falls by roughly 3.75%, and the general obligation debt service coverage tightens with it, before any reassessment lag is accounted for. Layer on the contingent liability of state insurer-of-last-resort assessments, and the municipal credit that looked diversified reveals a concentrated, correlated exposure to a single peril. Rating agencies have begun to disclose how climate risk enters their methodologies, and have bought climate analytics capacity to do so, which tells you where the spread pressure is heading (ECB, 2025; CEPR, 2025).
The sovereign that backstops a private business insurance market is essentially, in effect, writing an unfunded catastrophe reinsurance contract with no premium income and no reserve. Markets have been slow to price this kind of contingent liability because it is off balance sheet until the year it is not. That is exactly the kind of obligation that moves spreads in a step rather than a drift.
5. The Infrastructure and the Energy Transition Constraint
Infrastructure should be the asset class most insulated from the constraint, given its long contracts and stable cash flows. It is in fact among the most exposed, for a reason that ought to trouble anyone modelling the transition.
Framework 4: Infrastructure IRR under insurance repricing
Project finance depends on a binding insurance programme. Lenders require it as a condition of drawdown and as an ongoing covenant, because the debt is secured against a single, immovable, physically exposed asset. Insurance is therefore not merely an operating cost in the model; it is instead a gate at financial close and a tripwire thereafter.
Take a 25-year asset with a base-case equity IRR of 9.0% and an insurance cost of 1.2% of capital expenditure per year. Walking down the ladder with illustrative assumptions:
Framework 4 | Infrastructure equity IRR under insurance repricing
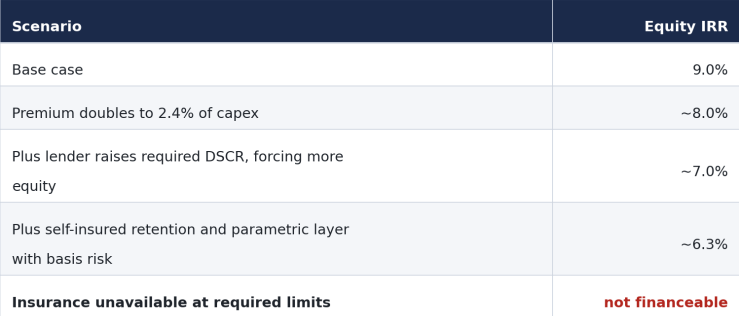
The first three steps are repricing, and an investor can demand compensation for them. The last step is the constraint, and it has no IRR because the project does not reach close. A risk-adjusted return on an asset that cannot be built is a category error.
The transition irony deserves emphasis because it is rarely confronted. The assets the energy transition most requires are disproportionately sited in high-hazard locations. Utility-scale solar is concentrated in hail and severe convective storm corridors. Offshore wind sits in the path of intensifying storms. Transmission lines run through fire-prone country and, in the worst cases, ignite the fires. Severe convective storms alone added USD 51 billion of insured losses in 2025 and have been the dominant loss category for several years (Swiss Re Institute, 2026). So the insurance constraint bites hardest precisely on the capital expenditure the climate response depends on. We are asking the insurance system to essentially underwrite, at scale and at an acceptable cost, the build-out of assets whose loss profile is deteriorating in real time. The market that is supposed to enable the transition is the same market that is repricing it out of reach in the locations that need it most.
This argues for treating insurability as a primary screen in infrastructure underwriting, on a par with offtake, counterparty and construction risk, rather than a box ticked late within diligence. The fund that learns this after financial close learns it expensively.
6. Private Markets and the Rise of Insurance-Linked Capital
If the regulated insurance market is retreating from the tail, the question then is who picks it up. Increasingly the answer has become private capital, and the consequences here run in two directions at once.
The catastrophe-bond and broader insurance-linked securities market has grown into a genuine asset class, with property and cyber-catastrophe bond notional outstanding about USD 58 billion and fifteen first-time sponsors accessing it in 2025 alone (Guy Carpenter, 2026). For an allocator, ILS offers a return stream whose principal driver, whether a hurricane makes landfall, is close to uncorrelated with equity and credit cycles. That diversification is real and valuable, and it explains the strong investor appetite that has helped soften reinsurance pricing. The capital is doing useful work: it is absorbing the peak risk that the traditional balance sheet cannot or will not hold.
The harder reading is what this migration says about the system. Risk is moving from regulated, reserved, supervised entities toward capital markets structures that are inherently lighter on all three counts. That is efficient in a perfect world where the modelling is sound and disclosure is honest. It is however fragile when the loss distribution is non-stationary, because the historical calibration on which a cat bond's coupon rests is the same degrading record that makes the underlying hazard hard to price. The retrocession and ILS layers are also where instability tends to surface first; analysts have flagged the upper, remote layers as being the most vulnerable point in the chain going into 2026 (KBW, 2025). A market that diversifies the holder of catastrophe risk does not diversify the risk itself. It redistributes a correlated exposure across a wider set of balance sheets, some of which understand it less well than the reinsurers they are replacing.
Parametric structures, which pay out on a measured trigger such as wind speed rather than on assessed loss, are spreading for the same reason: they sidestep the slow, contested claims process and give a financier a clean, contactable hedge. They also import basis risk, the gap between the trigger and the actual loss, which is fine until the year it is not. For private market investors the strategic read is that insurance-linked capital is becoming a permanent feature of the allocation landscape, attractive on diversification grounds, and the edge belongs to whoever takes the non-stationarity of the tail more seriously than the back-test does.
7. Cross-Asset Implications on the Capital Markets
The constraint here does not limit to only a single asset class. It propagates, and the propagation map is more useful than any single estimate.
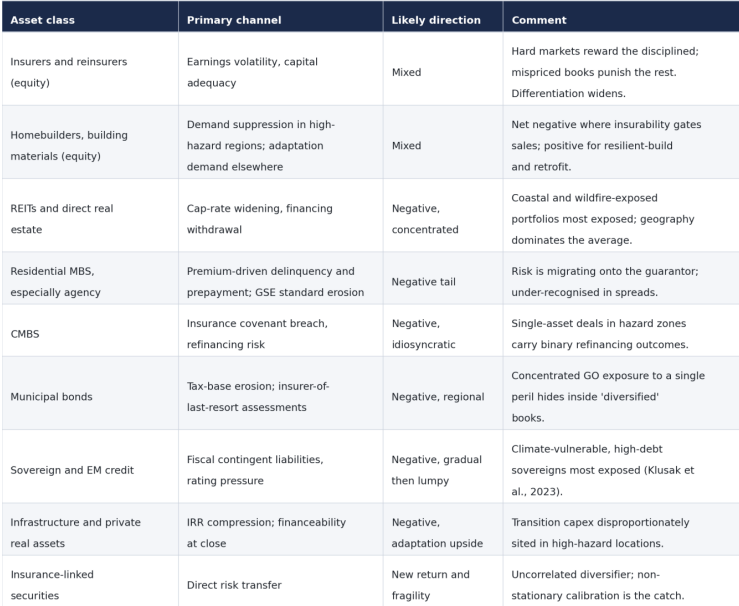
The connective thread across the table is that the average masks the dispersion. At the index level, a soft reinsurance market and resilient headline property prices suggest that the risk is contained. Underneath this all, the variance across regions, perils and capital structures is widening sharply. The trade, if there is one, is rarely the asset class; it is the spread between the insurable and the increasingly uninsurable within it.
8. Scenario Analysis
We frame three scenarios. They differ not in whether climate risk repricing happens, which we take as a given, but in its space, its breadth and the policy response, and therefore in whether it arrives as a drift or a dislocation.
The base case: orderly repricing within existing markets. Insurance risk continues to be repriced gradually inside functioning markets. Premiums tend to rise broadly in line with the 5 to 7% real loss trend (Swiss Re Institute, 2025). Reinsurance capital remains abundant and cyclical, attachment points stay elevated, and capacity withdrawal is confined to the most extreme micro-locations. Public backstops grow but they remain both politically and fiscally tolerable. Capital markets implication: a slow, persistent headwind. Cap rates in hazard-exposed real estate drift wider, high-hazard municipal and sovereign spreads carry a measurable but yet contained climate premium, and the dispersion within asset classes widens without a systematic event. Insurability becomes a standard line in diligence. This is the most likely path and also the one most prone to lulling allocators into treating a structural problem as a manageable cost.
The stress case: accelerated repricing and selective withdrawal. A cluster of peak loss years, or a sharp turn in the reinsurance cycle as capital exits after a bad outcome, accelerates the move. Carriers withdraw from whole regions rather than micro-locations, insurers of last resort balloon past their assessment capacity, and lenders begin to reflect insurability in mortgage availability rather than only in rate. The duration mismatch becomes visible here at scale as one-year contracts fail to renew against thirty-year debt. The capital markets implication: discrete repricing in affected regions. Coastal and wildfire-exposed real estate sees double-digit value declines through the combined cash-flow and cap-rate channels of Framework 1; agency MBS spreads widen as the guarantor's standard-erosion becomes a recognised liability; the most exposed municipal credits are downgraded; infrastructure projects in high-hazard sites struggle to reach close. The repricing is regional and lumpy, not uniform.
The dislocation case: systemic insurance retreat and fragmentation. Insurability contracts faster than capital, adaptation or policy can compensate. Whole categories of assets in whole regions become totally uninsurable at the required limits, so financing withdraws in steps, and capital allocation fragments along an insurability frontier that no longer tracks economic fundamentals. The public backstop here is overwhelmed and its contingent liabilities crystallise onto sovereign balance sheets, feeding the doom loop directly (CEPR, 2021; Klusak et al., 2023). The capital markets implication: regime change. Geography becomes a first-order driver of cross-asset returns; the all-cash market sets prices in stranded regions; sovereign and municipal spreads in exposed jurisdictions end up repricing both linearly and non-linearly; and the ILS market evaporates at precisely the moment it is most needed, because the events are larger and more frequent than the calibration assumed. We do not regard this as the central case. Rather we regard it as the case that the current softer market makes easiest to ignore.
9. Institutional Investment Implications
Several conclusions can follow for how a long-horizon institution should position, and most of them cut against current practice.
Treat insurability as a position-level risk factor, not a portfolio-level theme. Country-level ESG scores and climate ratings are too coarse to capture a phenomenon that operates at the level of the postcode, the peril and the capital structure. The exposure that matters here is essentially whether the asset can actually be insured at these limits at the next renewal, and that question now has to be asked asset by asset.
Model insurance as a forward-looking input to the discount rate, not a static line in operating costs. Framework 1 makes this point quantitatively: the cap-rate channel does more damage than the cash-flow channel because it capitalises the uncertainty about future availability. An underwriting model that holds the insurance line flat and the discount rate fixed is mismodelling the largest part of that risk.
Watch the duration mismatch as the central vulnerability. One year of cover versus multi-decade assets is the structural fault line. It is what converts a manageable cost into a binary availability problem, and it is invisible until the renewal that does not arrive.
Read the reinsurance cycle as a contrarian signal, not a confirmatory one. The current soft market, with rates down 12 to 15% and returns above the cost of capital, is the moment to conclude that the risk is contained (Guy Carpenter, 2026; Howden Re, 2026). Capital abundance is a cyclical state that masks a structural trend. The all-clear signal and the warning are, for once, the same data.
Price the public backstop as the unfunded reinsurance contract it is. Sovereign and municipal exposure to insurer-of-last-resort assessments and disaster liabilities is a contingent obligation that markets recognise late and reprice abruptly. The FAIR Plan's USD 1 billion assessment after the Los Angeles fires is a small, early instance of a much larger pattern (State Farm, 2025).
Finally, find the upside where it actually sits, which is in adaptation and resilience. As the insurability frontier moves, the relative value of assets that can demonstrate hardened, insurable, and financeable status rises. Resilient construction, retrofit, parametric-hedged infrastructure and the analytics that distinguish the insurable from the marginal are where the constraint creates return rather than only destroying it. The market is currently paying very little for resilience. That is unlikely to last.
10. Conclusion: The Insurance Constraint as a Systemic Macro Variable
Macro strategists are accustomed to a familiar set of state variables: rates, inflation, the credit cycle, and fiscal space. We think insurability belongs on that list, because it now sits upstream of the others. It feeds inflation through reconstruction and premium costs. It feeds fiscal policy through contingent liabilities that retreat from the private market and land on the state. And it feeds rates through the sovereign risk premium that climate-exposed, high-debt issuers will increasingly carry. A variable that touches all four is not a sector concern. It is rather a macro variable.
The reason it has been underweighted is that it does not behave like the others. Rates and inflation move continuously and are reported daily, so markets price them well. Insurability moves in steps, at the local level, on annual contracts, and it is reported, if at all, in the dry language of renewal terms and non-renewal notices. It is a discontinuous variable in a market structure that is built to price continuous ones. That mismatch is the source of the mispricing, and it is why the eventual repricing is likely to be lumpy, regional and non-linear rather than smooth.
The central climate-finance risk for capital markets is not rising insurance premiums; it is the loss of insurability at the limits required for financing. We have argued that this constraint bites through the renewal rather than the premium, and that the present abundance of reinsurance capital is masking a steady contraction of the insurability frontier beneath it. None of this requires a catastrophe to validate. It requires only that the historical loss record continue to be a worsening guide to the future, which it already is, and that capital continues to need a gate it can pass through, which it always will.
Insurance used to be what you arranged after the decision to deploy capital. In a growing set of places, it has become the decision. Capital does not flow where risk cannot be priced. The work for the next decade is to map, asset by asset, where that line falls, and to be positioned before the market notices it has moved.
References
Cevik, S. & Jalles, J.T. (2020). This Changes Everything: Climate Shocks and Sovereign Bonds. International Monetary Fund Working Paper.
Cevik, S. & Jalles, J.T. (2022). Climate Vulnerability and Sovereign Borrowing Costs. International Monetary Fund.
Centre for Economic Policy Research (CEPR). (2021). Climate Change Risks to Sovereign Debt.
Centre for Economic Policy Research (CEPR). (2025). From Words to Deeds: Incorporating Climate Risks into Sovereign Credit Ratings.
European Central Bank (ECB). (2025). Research Bulletin: Incorporating Climate Risks into Sovereign Credit Ratings.
Fannie Mae. (2026). Mortgage insurance and property coverage requirements guidance.
Guy Carpenter. (2026). January 1, 2026 Reinsurance Renewal Report.
Guy Carpenter. (2026). Global Property Catastrophe Rate-on-Line Index.
Howden Re. (2026). Re-balancing: January 1, 2026 Renewal Report.
Insurify. (2026). 2026 Home Insurance Trends Report.
KBW. (2025). Property Catastrophe and Retrocession Market Outlook.
Klusak, P., Agarwala, M., Burke, M., Kraemer, M. & Mohaddes, K. (2023). Rising Temperatures, Falling Ratings: The Effect of Climate Change on Sovereign Creditworthiness. Management Science, 69(12).
Levy Economics Institute. (2026). A Premium Crisis: Climate Change, Homeowners Insurance, Housing and Financial Stability.
Powell, J. (2025). Public remarks on insurance availability and regional financial access.
State Farm. (2024-2026). Public filings and disclosures regarding California policy non-renewals.
California Department of Insurance. (2024-2026). Market updates and regulatory filings.
California FAIR Plan Association. (2024-2026). Exposure reports and post-event assessments.
Swiss Re Institute. (2024). sigma 1/2024: Natural Catastrophes and Protection Gaps.
Swiss Re Institute. (2025). sigma 1/2025: Natural Catastrophes and Protection Gaps.
Swiss Re Institute. (2026). sigma 1/2026: Natural Catastrophes and Protection Gaps.
Urban Institute. (2025). Home Insurance, Mortgage Markets and the GSEs.
Yahoo Finance. (2026). Reporting on Fannie Mae insurance standard adjustments and homeowner insurance trends.
AI Disclosure: AI-assisted tools were utilised for research support, proofreading, grammar correction, and structural editing. The author retains full responsibility for the accuracy, analysis, opinions, and conclusions presented in this article.